Data Monitor
Every day, we are using 20+ monitoring tools to check the performance of 30+ services and 500+ applications across hardware and software.
Data Monitor was built to combine all those 20, to help people identify and fix issues easier.
Problem
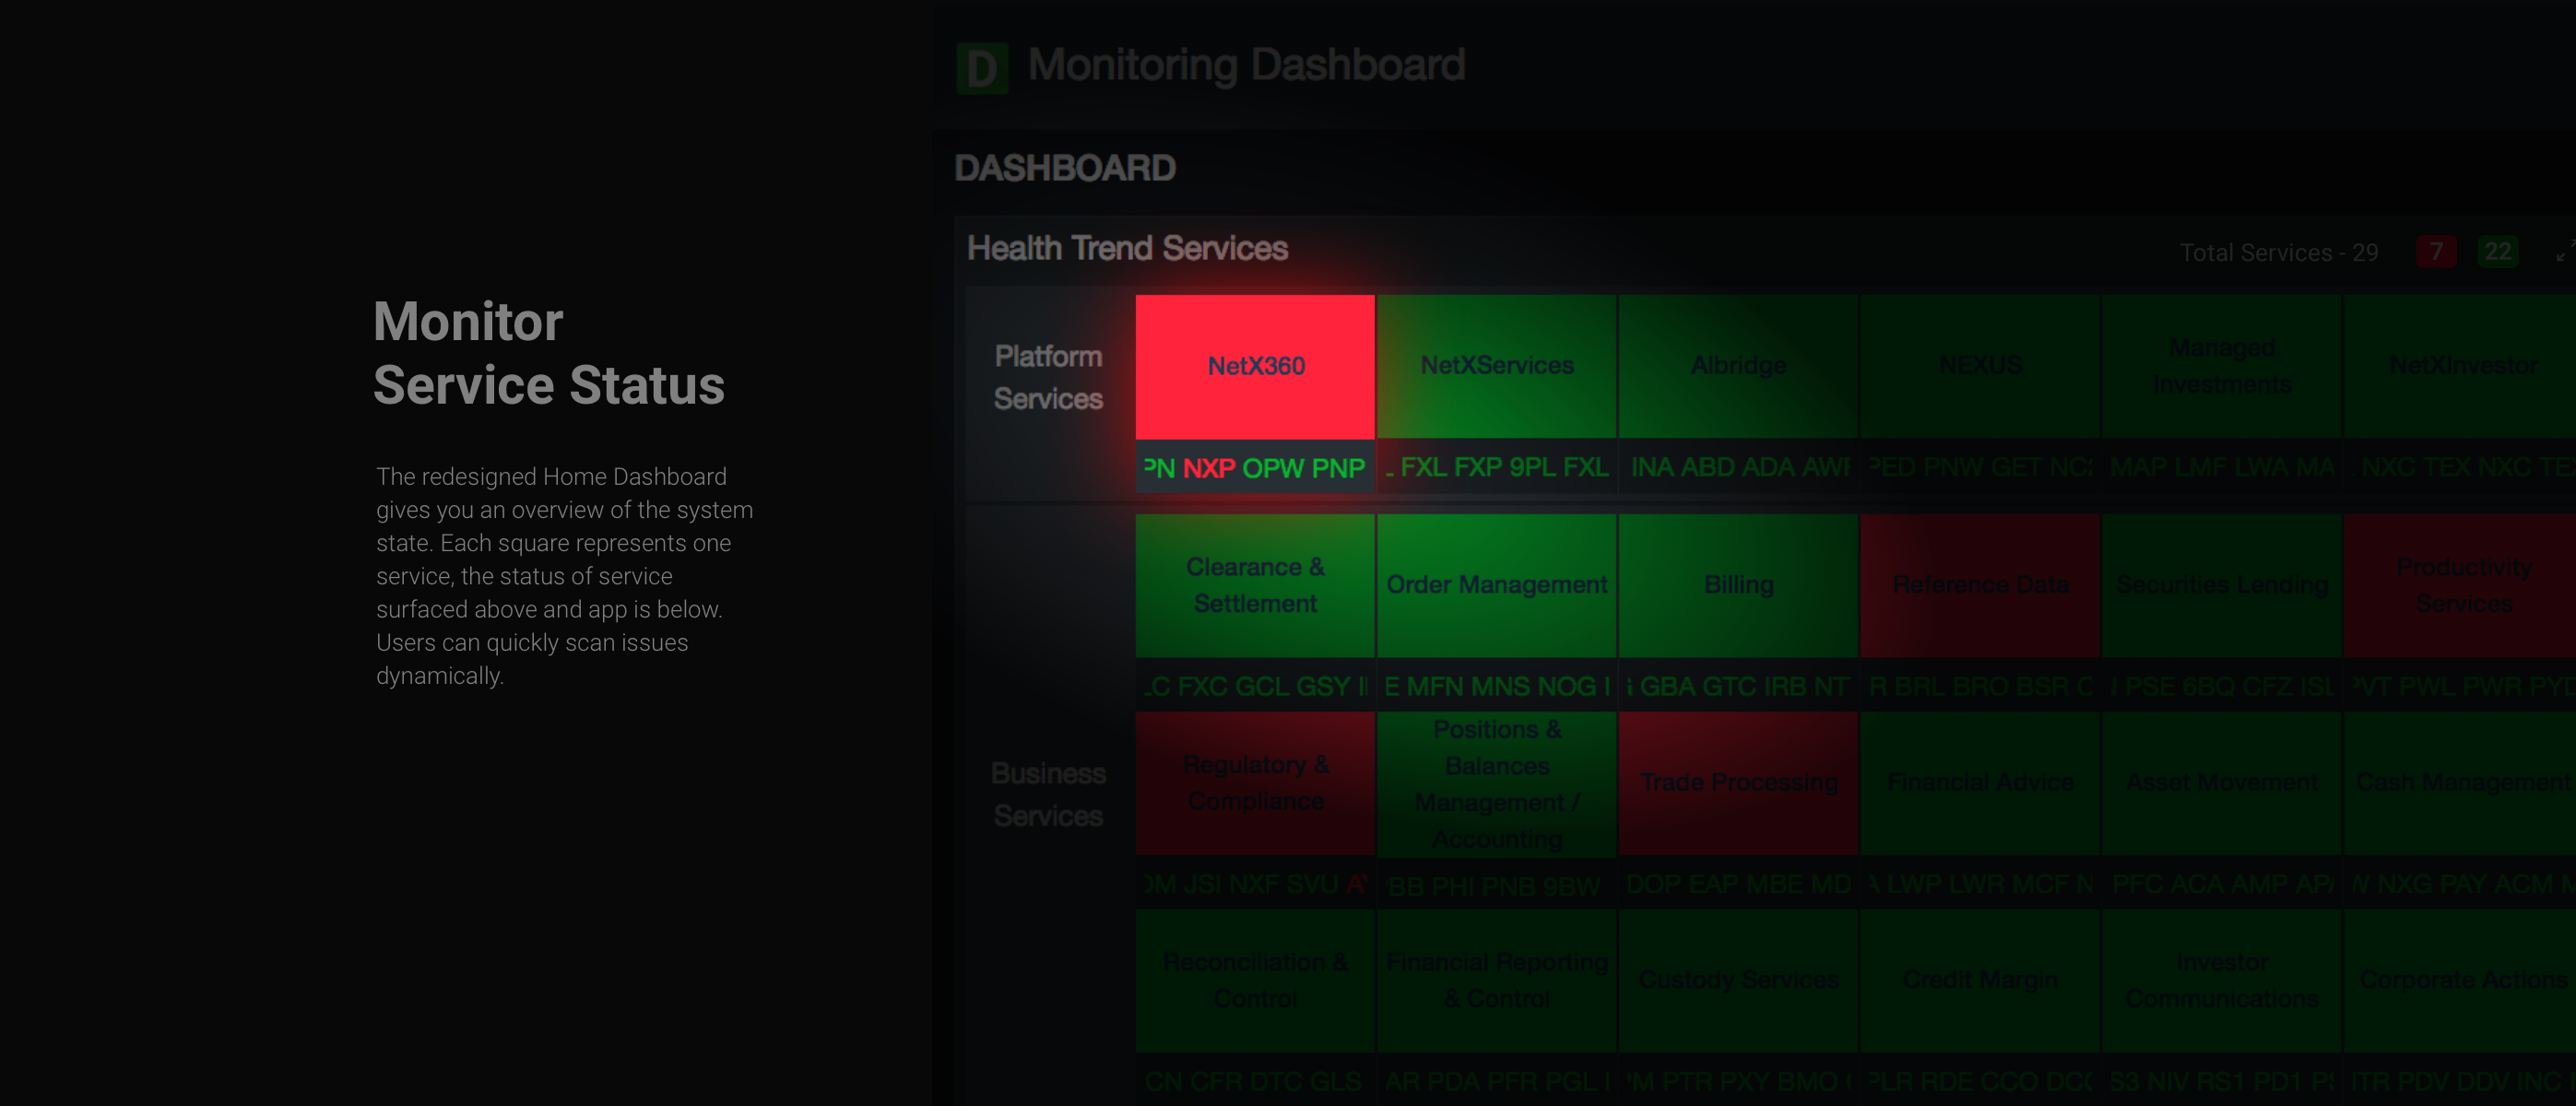
1.Super busy dashboard
2.Overcomplicated information
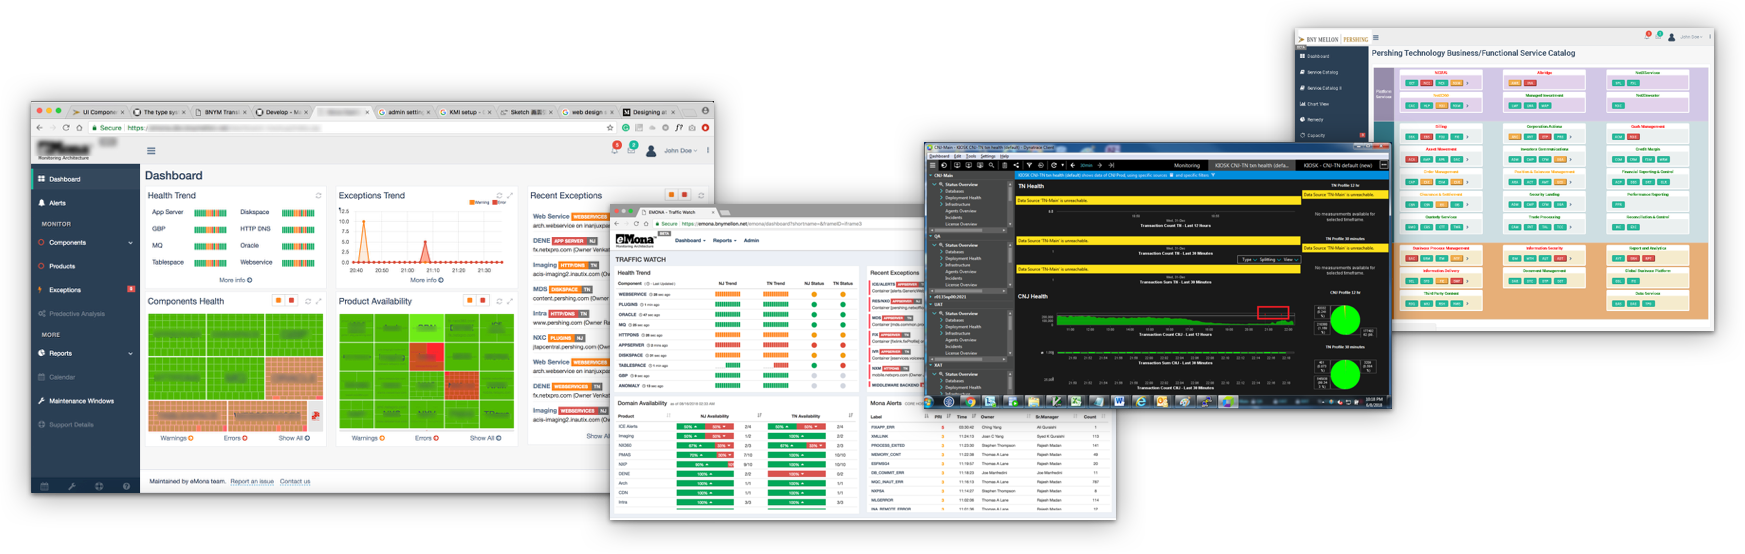
The current dashboard on the left
My Role
As a lead designer, I redesigned the legacy Consolidated Data Monitor from the ground up. Our legacy version could not meet the business goal to enable operation and management teams to quickly scan and fix issues. I was asked to redesign the old dashboard, catching up to new standards, re-evaluate user flow, rebuild IA, and redesign visuals and interactions.
Process
I cooperated with Product Owners to understand the business goal. Worked closely with data scientists and developers to rebuild the IA and workflow. Helped PM and BA to iterate requirements to align the product goal and design goal across multiple teams.
Who are the users
Technical users who fix issues.
Non-technical users who manage applications or services

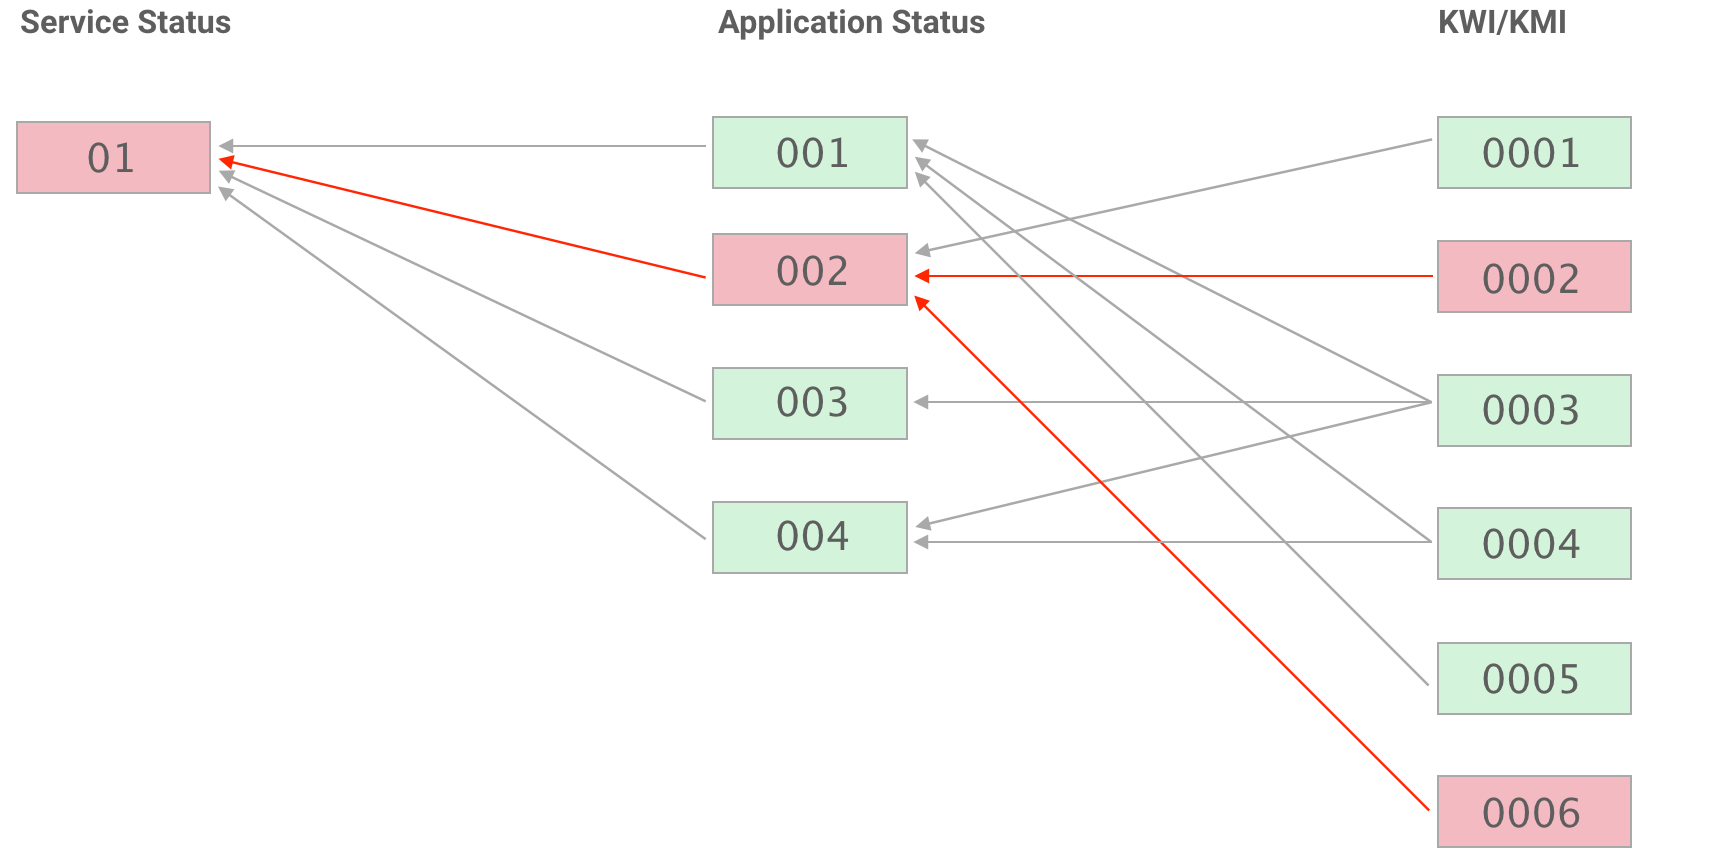
Information Architecture
There are 33 services in the system, 5-100 applications in each service, and multiple KWI/KMI indicate the performance of the application. If one of the KWI/KMI indicate an issue, might affect multiple applications, the worst case will trigger the whole service offline.