Forest Growth Visualizer
"Forest Growth Visualizer" visualizeds scientific data pertaining to forest growth that was collected over a span of two and half years. Scientsts can view and interact with the visualization using an interace that I developed in order to understand and ideally discover key factors that might have contributed towards the growth of tropical forests.
My personal goals in this study were to understand how to go about visual designing an environment where one could visualize large quantities of data, and also explore the role of interactivity in revealing hidden relationships amongst the data elements that could potentially lead to unanticipated discoveries.
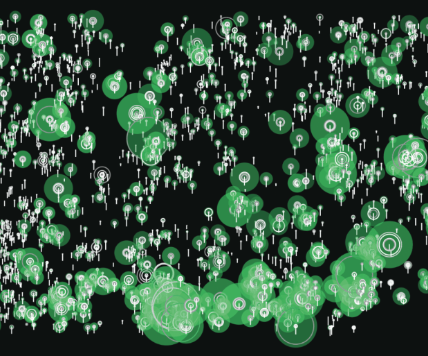
As the tree's growth visualized through the size of green circle on its position in the plot, the bigger and larger green circles on the right down of the plot suggest scientist that geographic condition is an important factor to study, besides sunshine, species and weather.
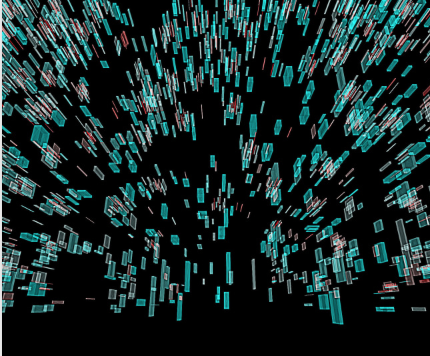
In this case, we found that 3D image doesn't means super view for data observation. On the contrary, it transforms the shape of data, and leads miss understanding.
Tree's location on the plot

The relationship between growth and photometric
Place Rhythm 地方时间
地球上没有一个相同的地点。 “地点钟”透过微博的发送地点和地点,让我们我们有机会偷窥这些地方的人与事:如何生活、如何热爱、如何诉说,尤其如何渡过他们的白天与黑夜,在时间纬度上定义空间的意义。
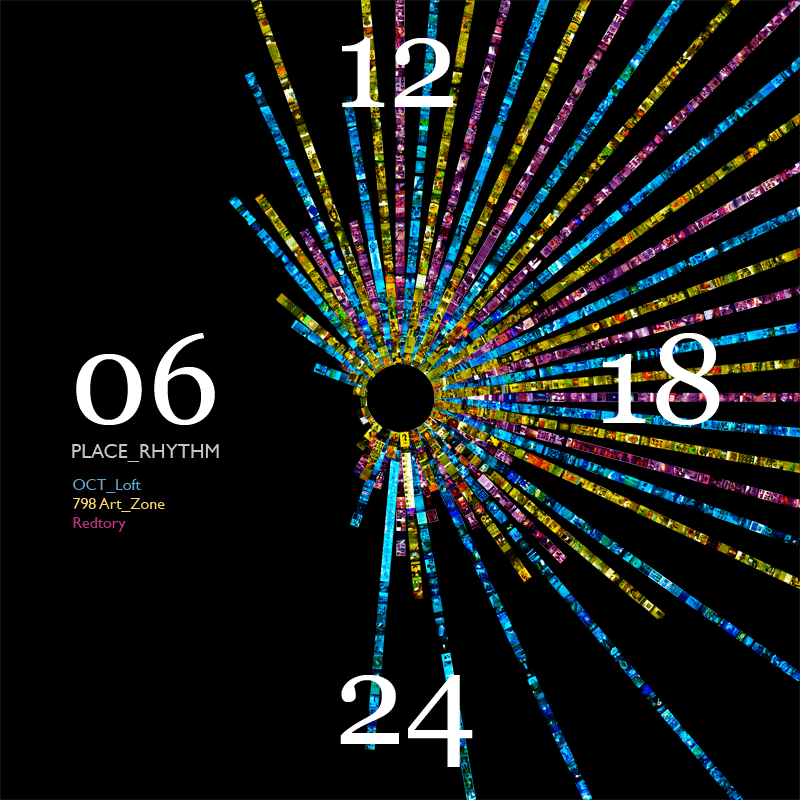
Places Rhythm of Downtown Lofts
The Weibo photos ( Chinese twitter ) from three art loft areas, Beijing 798, Shenzhen OCT loft and Guangzhou Retory Loft, were arranged on a clock. Obviously, Beijing798 ( in Yellow ) were exposed largely by uncomparable twittes in the day time, and Shenzhen OCT ( in Blue ) loft is a place that where people love to stay to late.