︎︎OCT-LOFT
︎︎Zlab
2013
Technology Support Zlab
My Role: UX Design
/Data Visualizer
The Design Edge:
Inside/Outside in
the OCT-LOFT
Creative Festival
2013
Shenzhen,China
3D Modeling
Build up visual mocks of the gallery of Jellyfish Space.
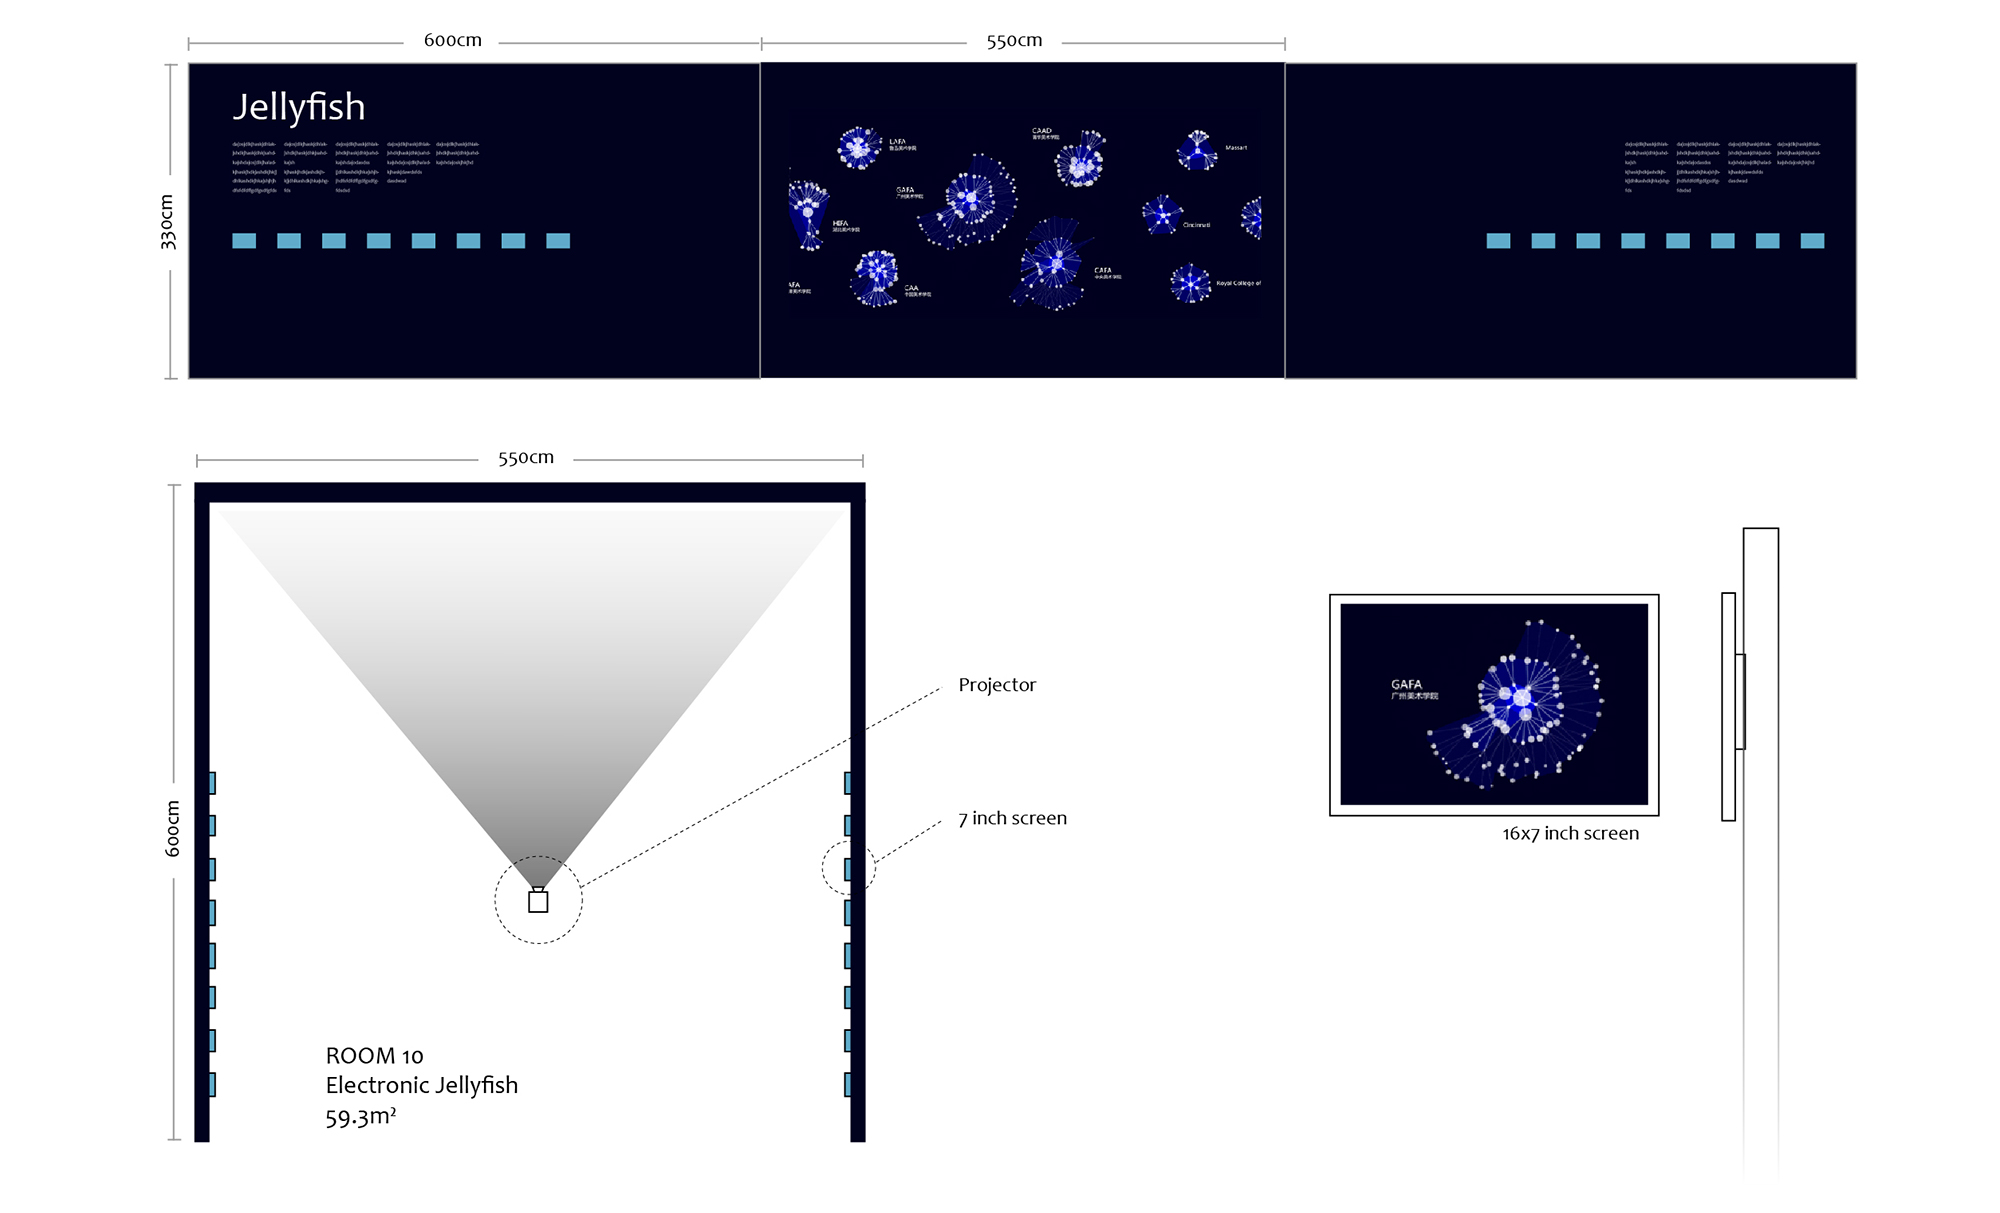
Equitpment Need
We finally used 2 projectors and 4 small screens

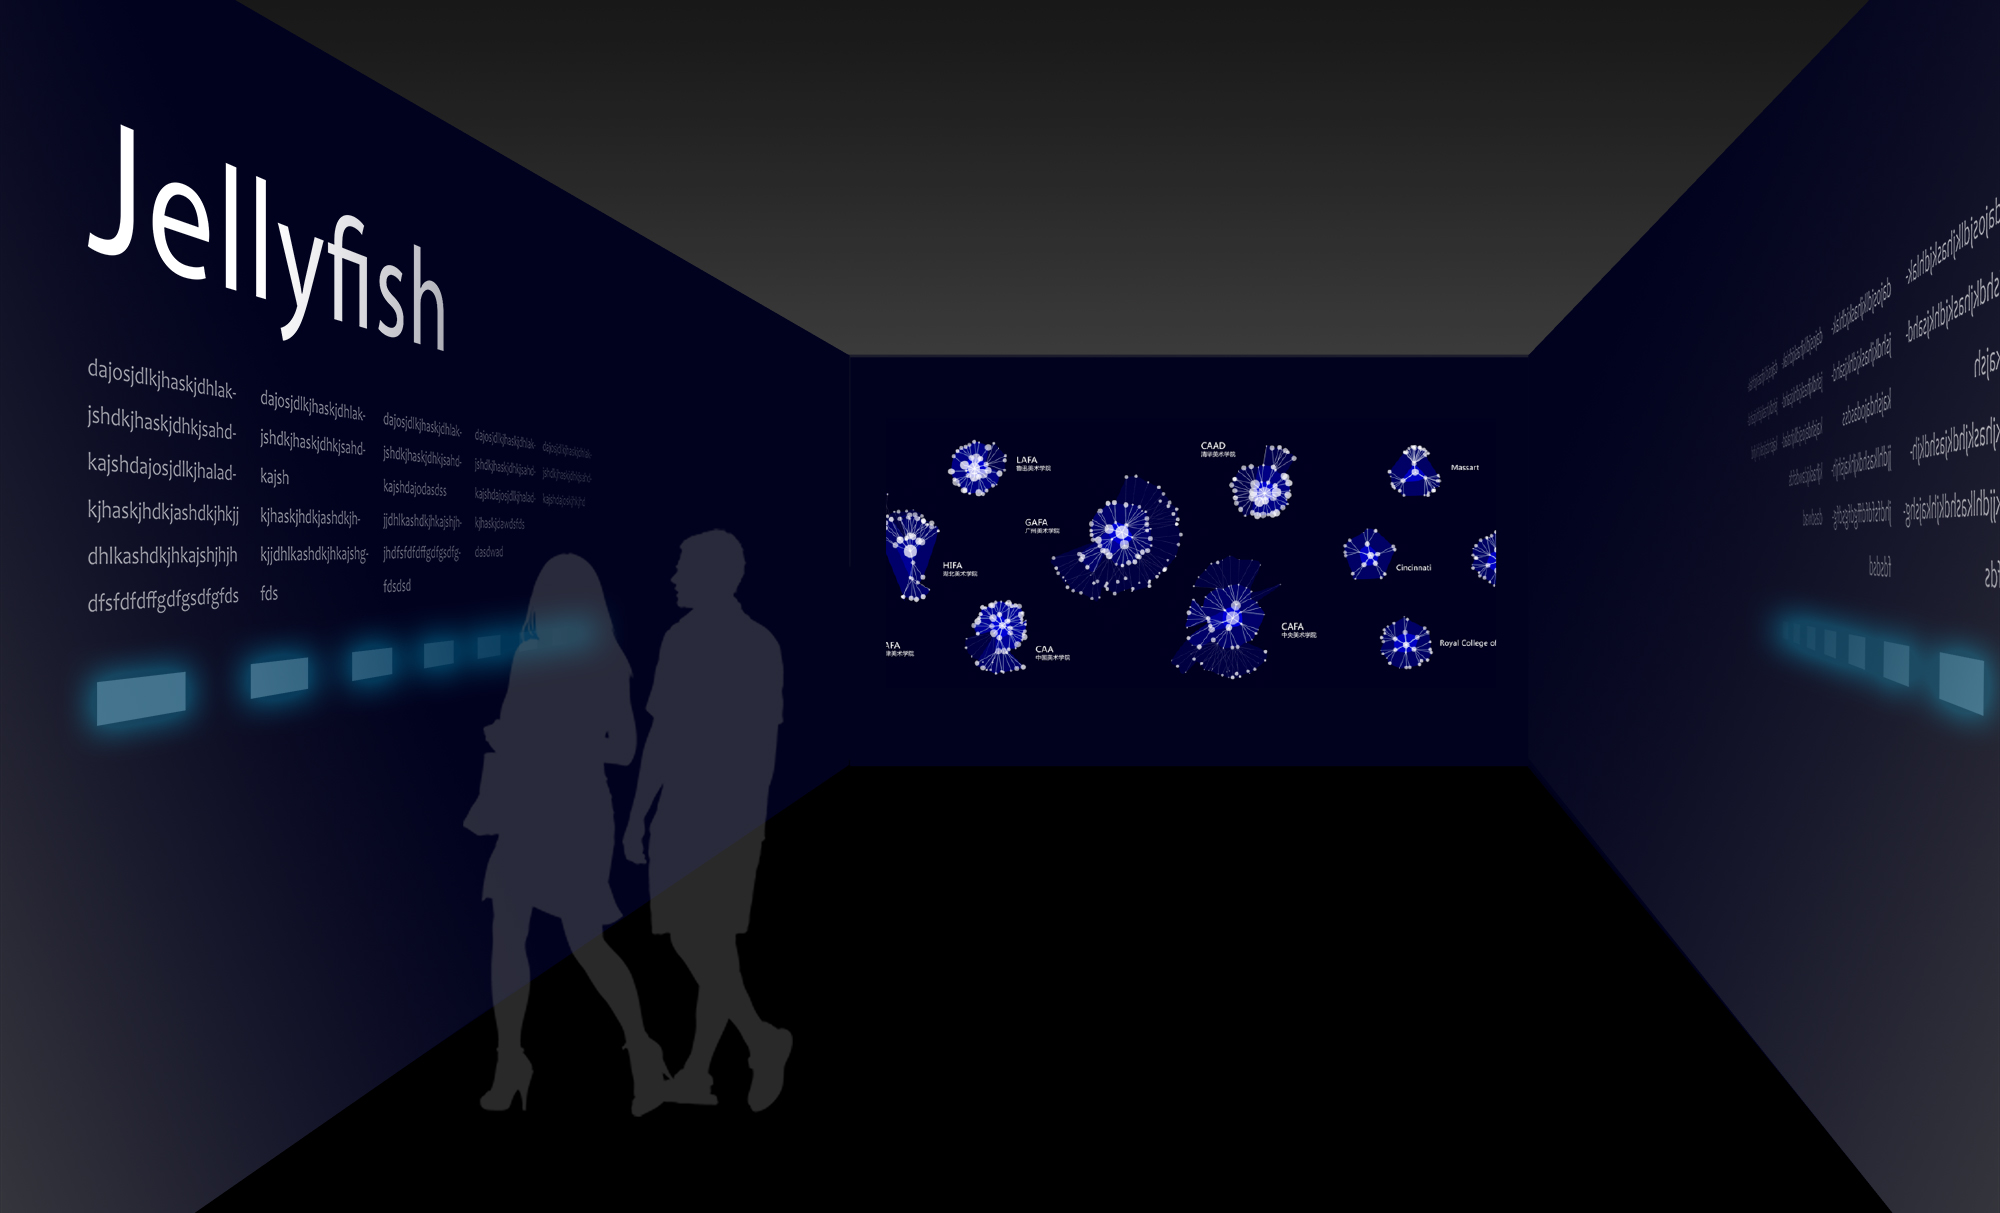
Tank View
Shows the whole set of data collected from 16 schools' official websites.
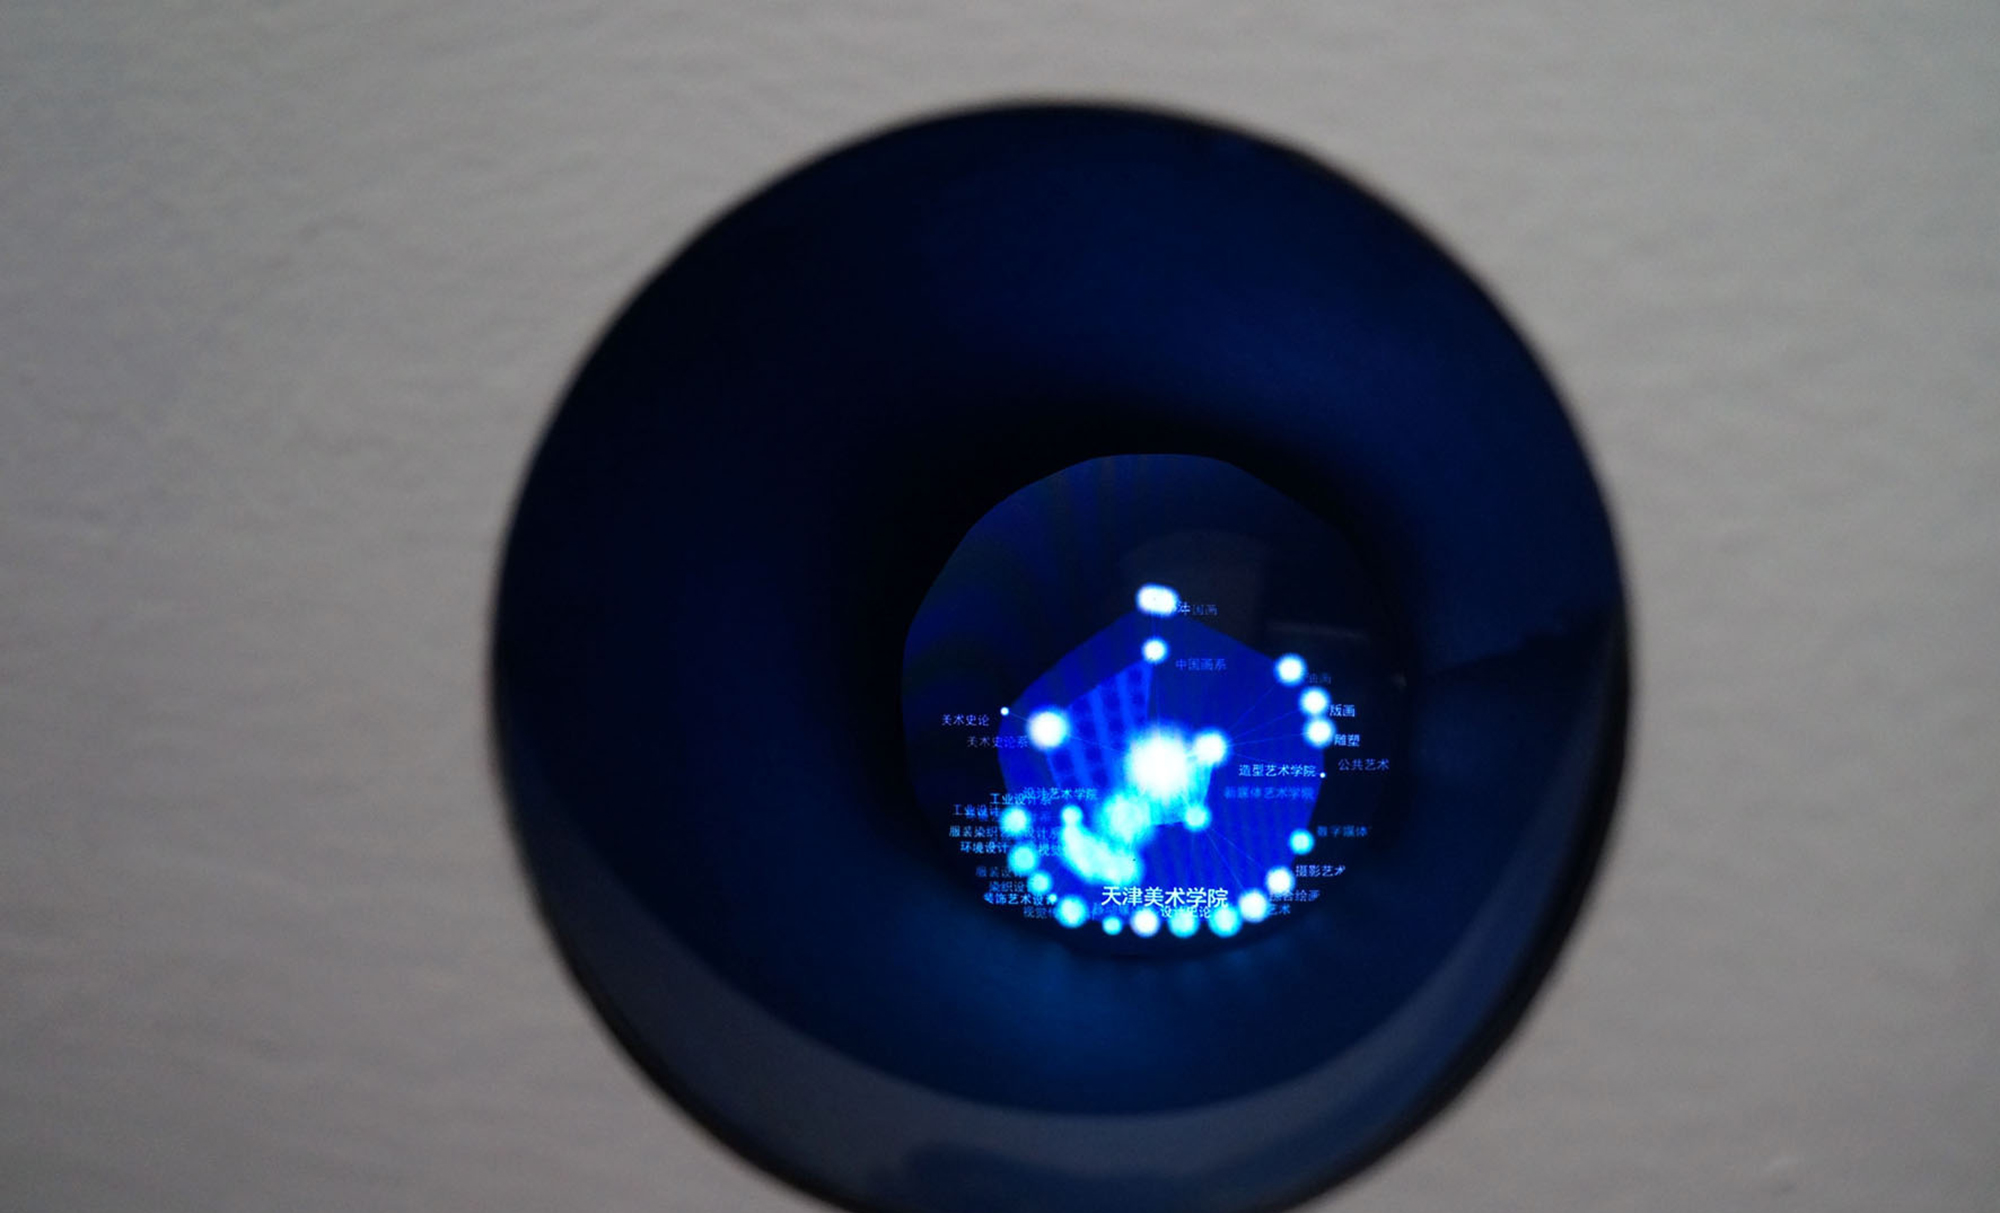
Pinhole View
Shows more detail structure about an education institute.
-
Design Process
︎
INFO
The structural formulas of Design Colleges visualized from the data collected from 16 schools' official websites, such as parsons school, Art Center College of Design, MassArt, School of Visual Art, Central Academy of Art(China) and Guangzhou Academy of Fine Art.
This project was selected by the international design education exhibition, We have designed two installations, to involve users into a explorative space with different views, looking through a pinhole or emerging into a tank.
This project involves visual mocks, user research, instillation 3D modeling, technology testing, and a prototype completed in 10 days.